May and June were good months for Firefox's Speedometer performance compared to Chrome. ( mozilla.social )
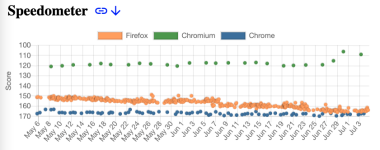
A graph showing the Speedometer benchmark comparing Firefox, Chromium and Chrome. In the graph, lower is better. The top of the graph shows Chromium at around the 120 mark, with a slight change for the worse towards the end of June. The middle of the graph shows Firefox, rapidly closing in on Chrome, moving from ~150 to ~165. The bottom fo the graph shows Chrome fairly steady between ~165 and ~170.
ALT

You are only browsing one thread in the discussion! All comments are available on the post page.

Return

Spuddaccino ,

It seems like an odd choice to put bigger numbers lower down, when we generally associate them with up. Any idea why it’s visualized that way?

PierreKanazawa ,
@PierreKanazawa@fedia.io avatar

Could be a score about time. Small numbers = faster = better = up.

SVT ,

I think it is so that on all graphs “lower” down is better. But agree it’s kind of unusual layout. Looking at the graphs for Linux i wonder what happened in feb 11:th this year - where all values for Firefox got a lot worse.

wisniewskit ,

Sometimes the hardware or software configurations of the machines running the tests changes, or a bug in the test harness itself is fixed, which can skew all of the results at once.

  • All
  • Subscribed
  • Moderated
  • Favorites
  • random
  • [email protected]
  • All magazines